Data Quality Visualization
Once a data quality data type is added to a Data Object class, the computed score for each Data Object is visible:
- in the Data Object editor,
- in the Data Object grid,
- in the Data Object tree (depending on configuration).
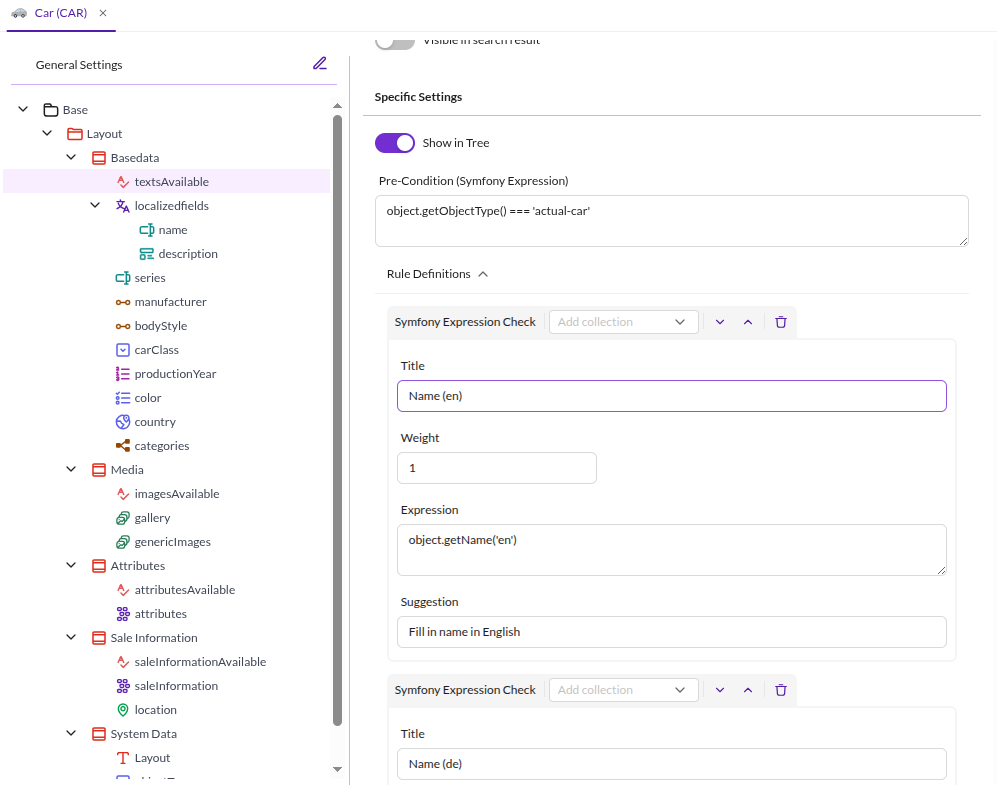
The screenshots on this page use the Car class's data quality rules from the reference demo. The class defines
one data quality type per editor panel, each built from Symfony Expression Checks:
- Texts Available (
textsAvailable,Basedatapanel): one Symfony Expression Check per localized text field, six in total (NameandDescription, each inen,deandfr). The "Name (en)" check uses the expressionobject.getName('en')and the suggestion "Fill in name in English". A precondition,object.getObjectType() === 'actual-car', limits the rule to Data Objects of typeactual-car, so it only scores objects representing an actual car. - Images Available (
imagesAvailable,Mediapanel): verifies that images are present. - Attributes Available (
attributesAvailable,Attributespanel): verifies that attributes are filled. - Sale Information Available (
saleInformationAvailable,Sale Informationpanel): verifies that sale information is filled.

Data Object Editor
Depending on the class definition, the computed data quality score(s) for a Data Object appear directly in its editor.
Filling in new fields updates the scores only after reloading the Data Object. Changing the rules used to compute a score in the class definition likewise requires reloading the Data Object to see the updated score.
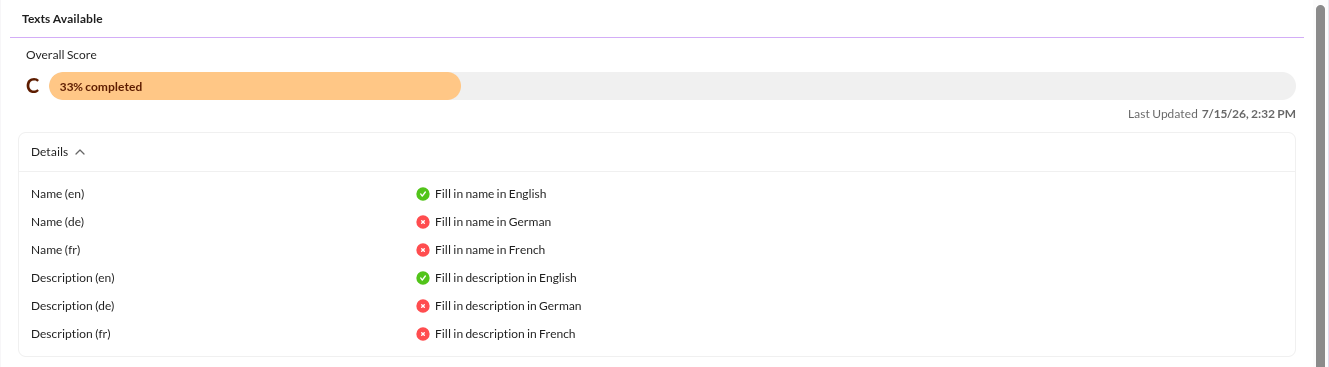
Each data quality type renders as a score bar at the top of its panel, showing the mark and the completion
percentage, for example Texts Available: C, 33% completed at the top of the Basedata panel. Each panel's
score bar is computed only from the rule definitions configured for that data quality type, so panels can show
different marks on the same Data Object.


In this example the Texts Available score is lowered because only its two English checks pass, while the German
and French ones fail. The percentage is the sum of the passing checks' weights divided by the sum of all of them,
so every failing check pulls it down and the mark drops below A.
The Data Quality Details tab lists every data quality score computed for the current Data Object, and the
suggestion configured for each check next to a pass or fail marker (here, "Fill in name in German" for the
missing German name).

Data Object Grid
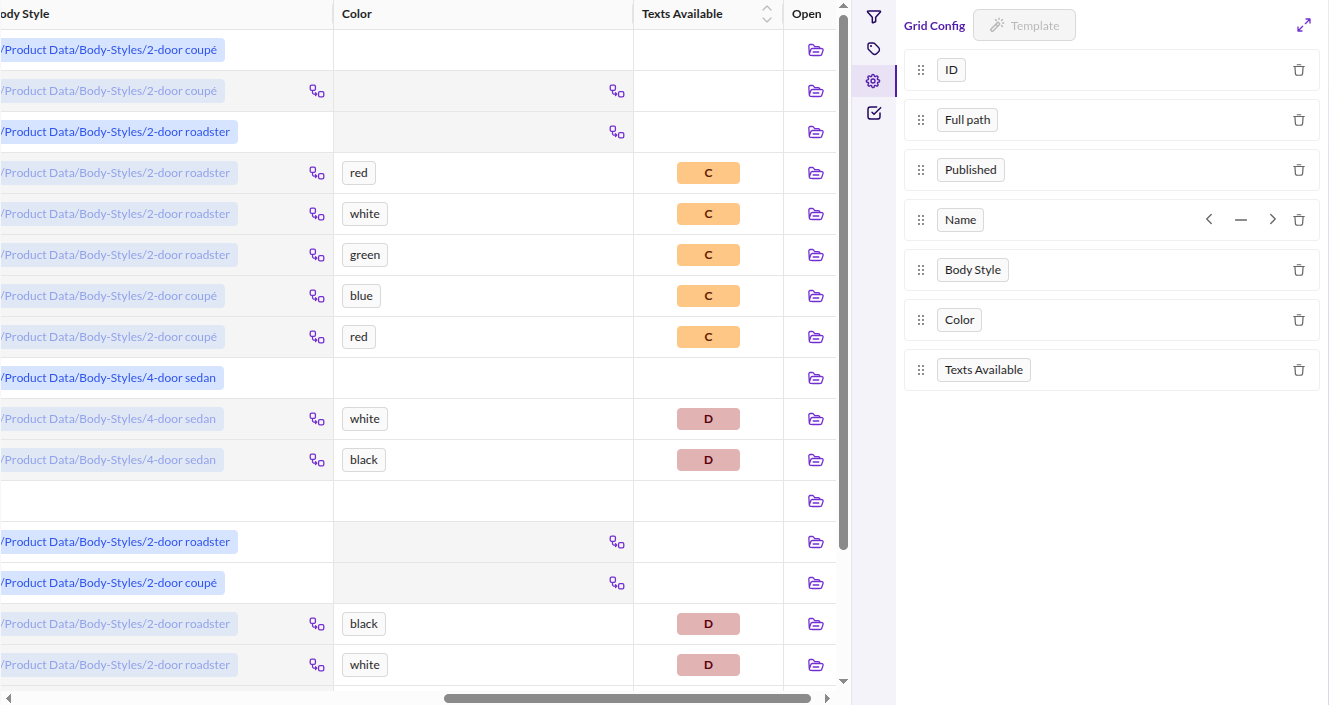
Add data quality scores as columns in a Data Object grid through the grid's column configuration.

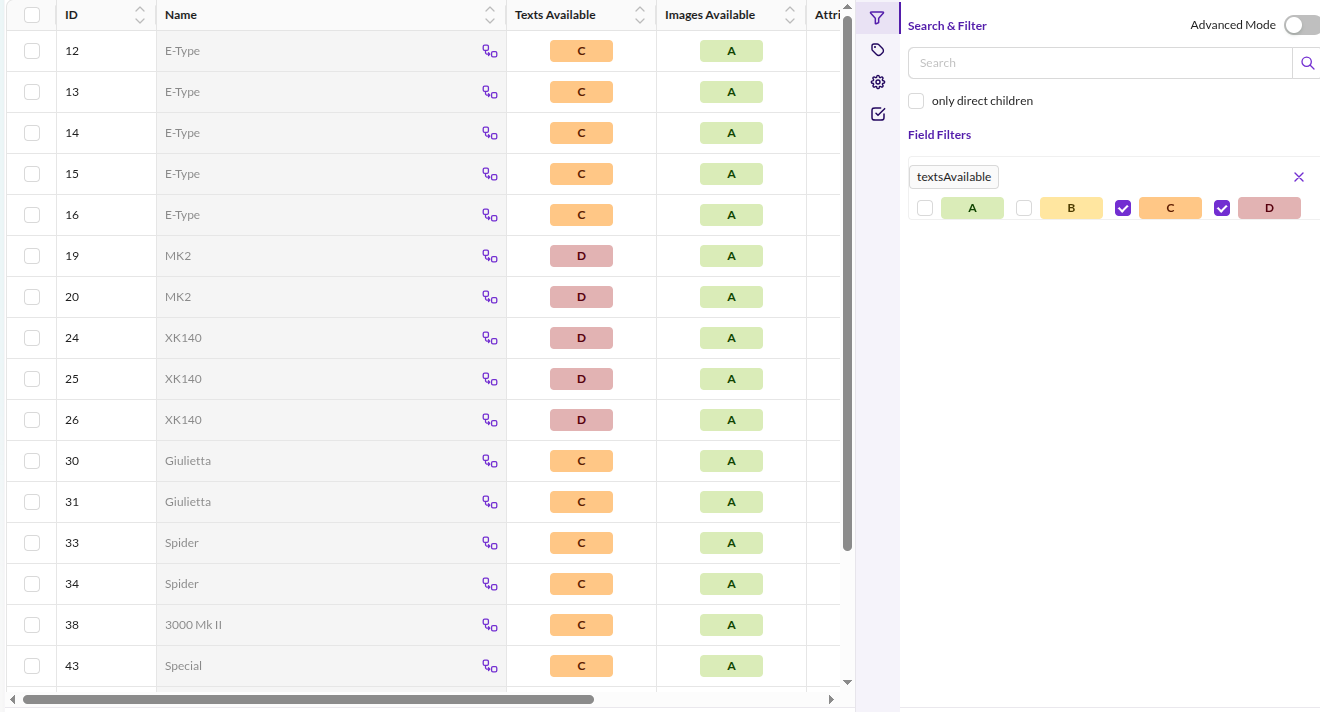
Each added score becomes a read-only grid column. Sort by the column header, and filter by adding the column as a field filter in the Search & Filter panel, where each mark is a separate checkbox.

CSV and XLSX exports include only the scores, without color.
Filtering by data quality via the grid API
Data quality columns also support the grid's general columnFilter mechanism (see the Studio Backend
Grid documentation
for the full filter contract). The dataQuality filter type restricts results to one or more score marks:
| Type | filterValue | Options | key required |
|---|---|---|---|
dataQuality | array of strings | A, B, C, D | true |
key is the name of the data quality field to filter on. For example, to filter a textsAvailable data quality
column for scores A and B:
...
"columnFilters": [
  {
    "key": "textsAvailable",
    "type": "dataQuality",
    "filterValue": ["A", "B"]
  }
]
...
Data Object Tree
Enable Show in Tree in the class definition to display the
available data quality scores (that is, scores meeting their
precondition, if any) next to the Data Object name in the tree.
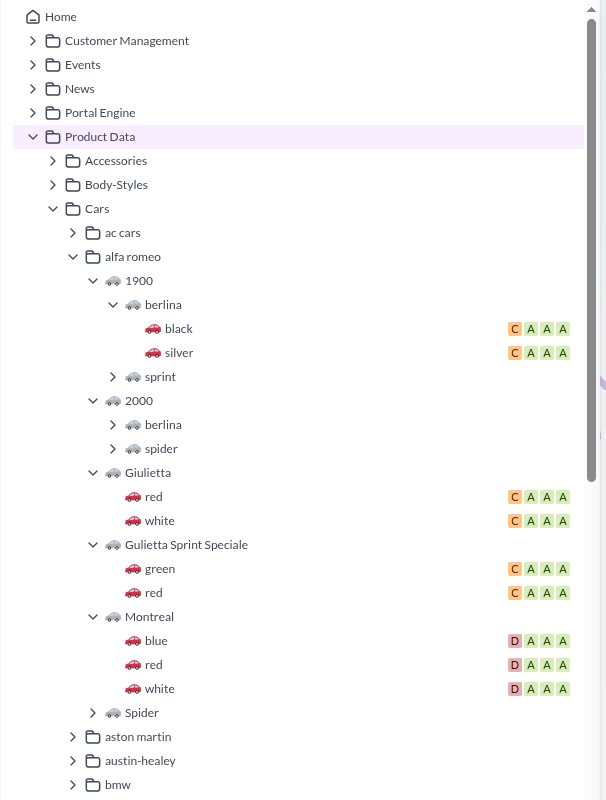

Objects that do not meet the data quality type's precondition carry no badge at all, which is why the model and variant nodes in the example above are unmarked while the individual cars below them are graded. Pimcore Studio dims the node icon of unpublished objects, but renders their score badges the same as published ones.
Style score badges with CSS classes; see Custom Score Badges.
After changing the rules used to compute a score in the class definition, reload the tree (Refresh in the
context menu) to show the updated scores.
Studio Dashboards
Data quality scores can also be visualized in aggregate, across all objects of a class, using dashboard widgets. See Studio Dashboards.