Custom Report Integration
Overview
Statistics Explorer integrates with Pimcore's Custom Reports through two data source adapters, one per statistic mode. Reports built on these adapters are configured and opened in Pimcore Studio like any other custom report.
Data Source Configuration
When integrated with Custom Reports, Statistics Explorer automatically adds the following data sources:
- Assets table
- Documents table
- All object tables (including basic and localized tables, if available)
- Generic Data Index tables (if the Generic Data Index bundle is installed, all data object class indices are included)
Add further data sources via:
Deactivate Data Source Auto Adding
By default, Statistics Explorer adds the supported data sources automatically. Disable this behavior in the Symfony configuration:
pimcore_statistics_explorer:
    custom_reports:
        data_source_configurations:
          auto_adding: false
Blocklists for Data Sources and Attributes
The block_list node excludes specific data sources or attributes from the custom reports integration. Configure it
at three levels:
- Class blocklist – Exclude entire object classes.
- Class attribute blocklist – Exclude specific attributes within certain classes.
- Global attribute blocklist – Exclude attributes across all data sources
The blocklist entries for attributes are regex definitions to match multiple attributes with one entry.
pimcore_statistics_explorer:
    custom_reports:
        data_source_configurations:
            block_list:
                # List of class IDs to exclude
                classes:
                    - CAR
                    - EV
                # Class ID and list of attributes to exclude
                class_attributes:
                    EV:
                        - '/id/'
                        - '/user.*/'
                # Regex for matching attributes to exclude globally
                global_attributes:
                    - '/oo_.*/'
By default, Statistics Explorer excludes certain attributes from data object tables and internal Generic Data Index fields:
pimcore_statistics_explorer:
    custom_reports:
        data_source_configurations:
            block_list:
                global_attributes:
                    - '/oo_.*/'
                    - '/.*\.sort$/'
                    - '/.*\.details\.crop.*/'
                    - '/.*\.details\.hotspot.*/'
                    - '/.*\.details\.marker.*/'
Creating Reports
Use Statistics Explorer Adapters
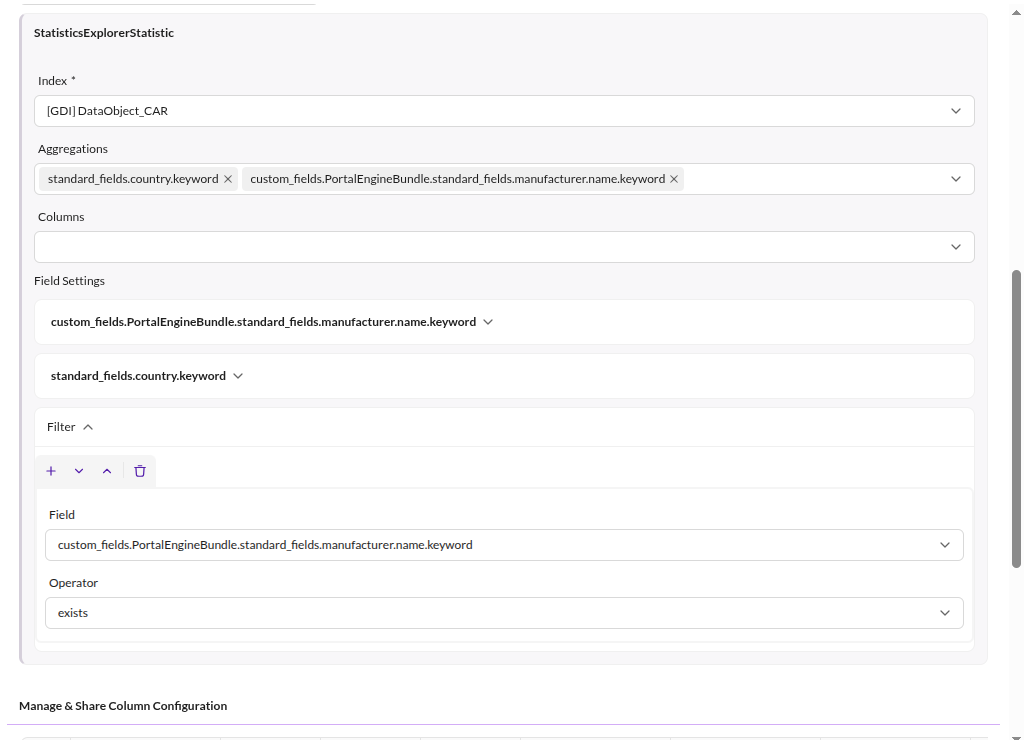

To create a Custom Report using Statistics Explorer, create a new Custom Report and select one of these adapters:
StatisticsExplorerStatistic: Generates reports in statistics modeStatisticsExplorerList: Generates reports in list mode
Refer to the detailed adapter documentation for further information and any limitations.
Column Configuration
Additional column settings customize the report output:
- Visibility – Choose which columns are displayed.
- Export Settings – Include or exclude columns from exports.
- Sorting & Filtering – Enable ordering and filtering on specific columns.
- Label & Width – Define custom labels and column widths.
- Actions – Add interactive options, such as opening data objects by ID.
The available settings depend on the selected adapter and the column type.
Chart Settings
A report optionally renders its result as a chart. When configuring a chart:
- Select the chart type:
pie,lineorbar. - Define the necessary axes and columns.
- Match the chart type to the report structure - not every type fits every data set.
Open Reports
Open finished reports in the Reports section of Pimcore Studio to analyze them, view their visualization and export the data.
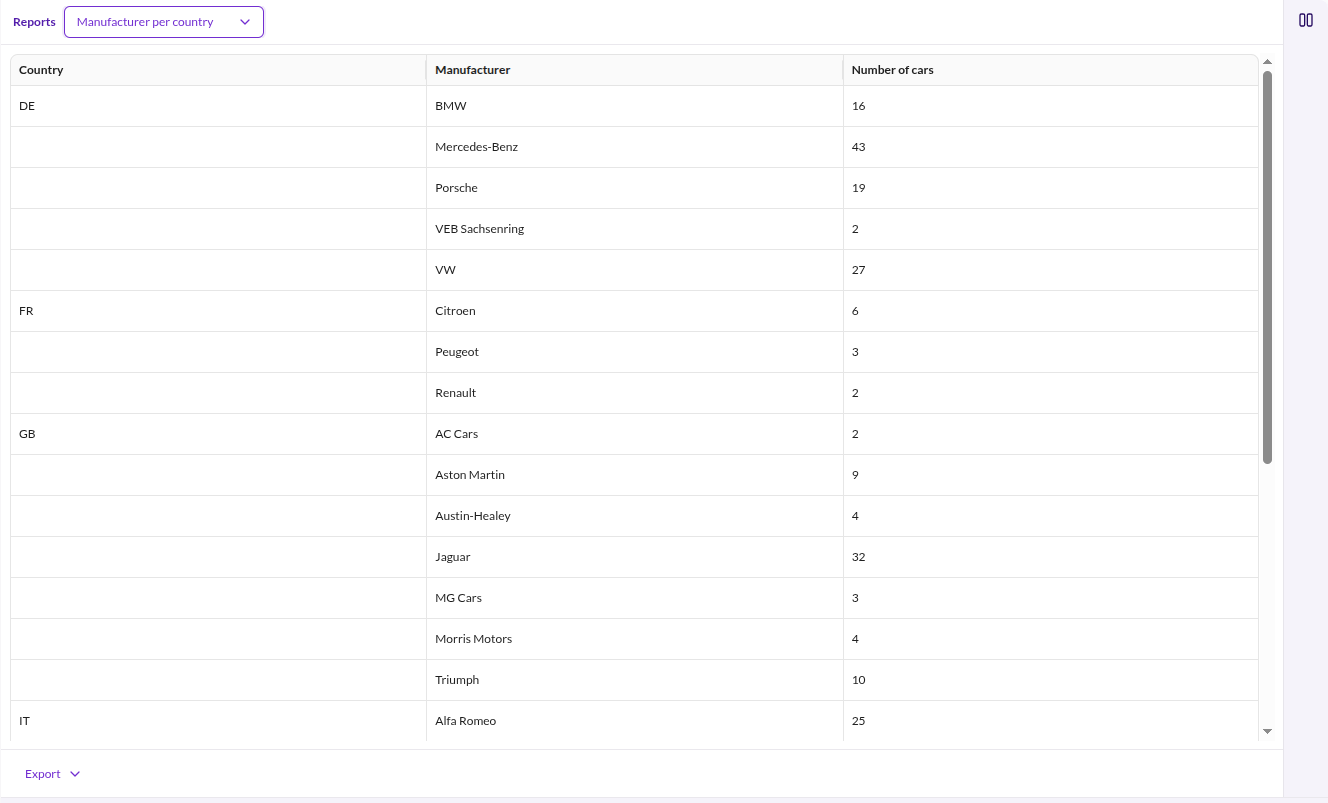

A report with a chart type set renders the chart above the result table.
Extending the Custom Reports Integration
Statistics Explorer dispatches pre-response events while assembling the data sources, fields and field settings that Pimcore Studio offers in the report configuration. Use them to add, filter or relabel entries. See Custom Report Data Source Events.