Statistics Mode
The Statistics Mode enables the creation of aggregated reports, calculating metrics, and generating pivot tables. It allows grouping, filtering, and summarizing data to extract insights.
Example Use Cases:
- Logins over time
- Objects or assets per type
- Most downloaded assets
- Average price per category
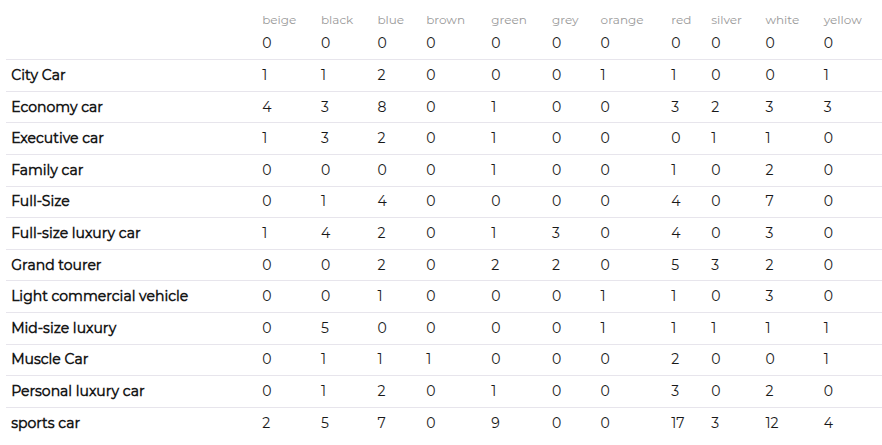
- Products per category and color
Configuration Options
Find detailed documentation on configuration options below.
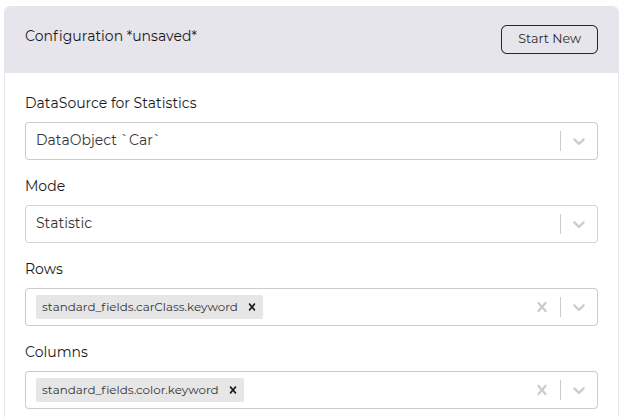
Aggregations / Rows
Aggregations define how data is grouped within a report. The grouping attributes determine how the data is structured and summarized. The available attributes are defined by the selected data source.
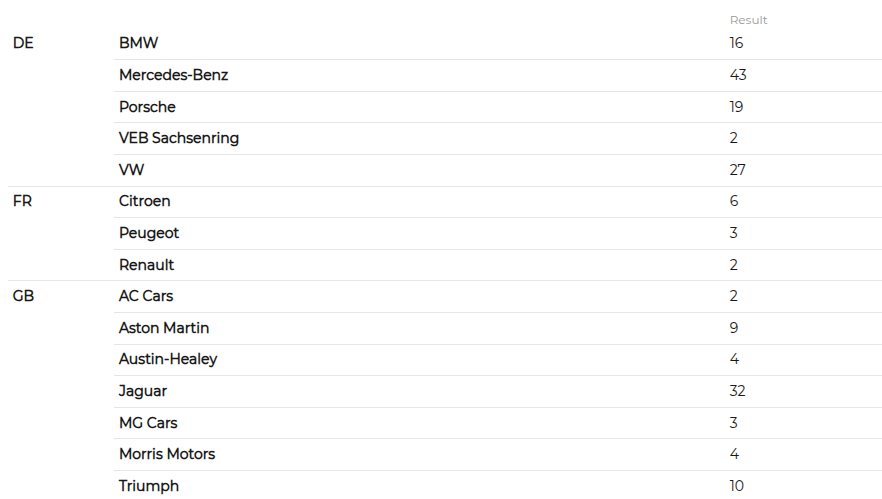
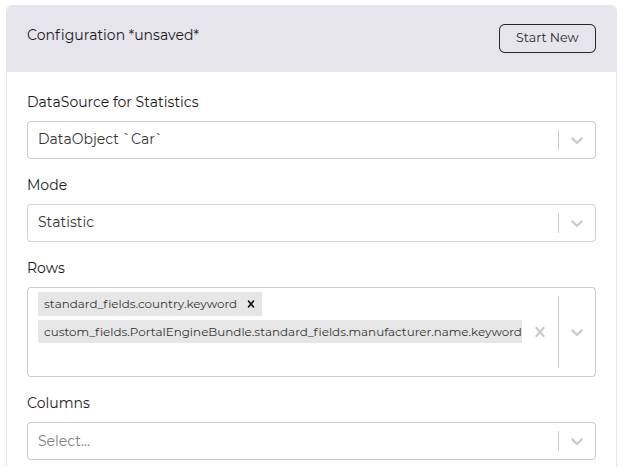
Multiple attributes can be used for grouping, allowing for more granular analysis. For example, grouping by Country and Manufacturer provides insights into product distribution across different regions and brands.
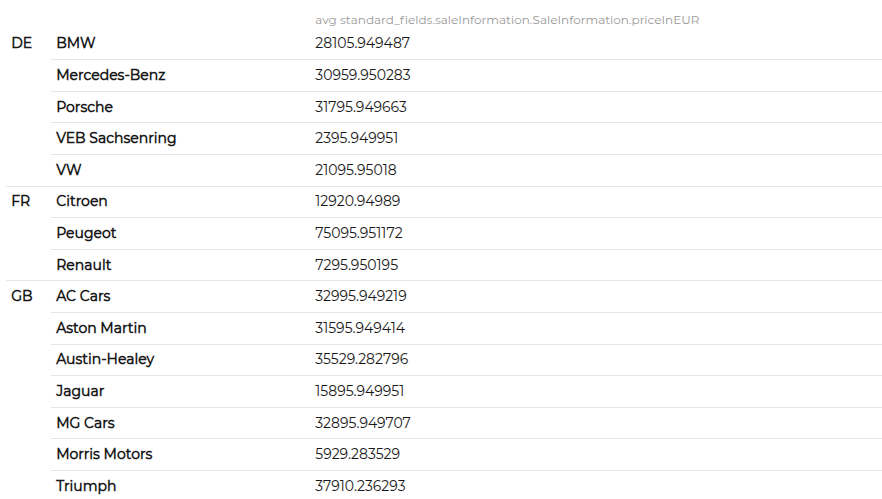
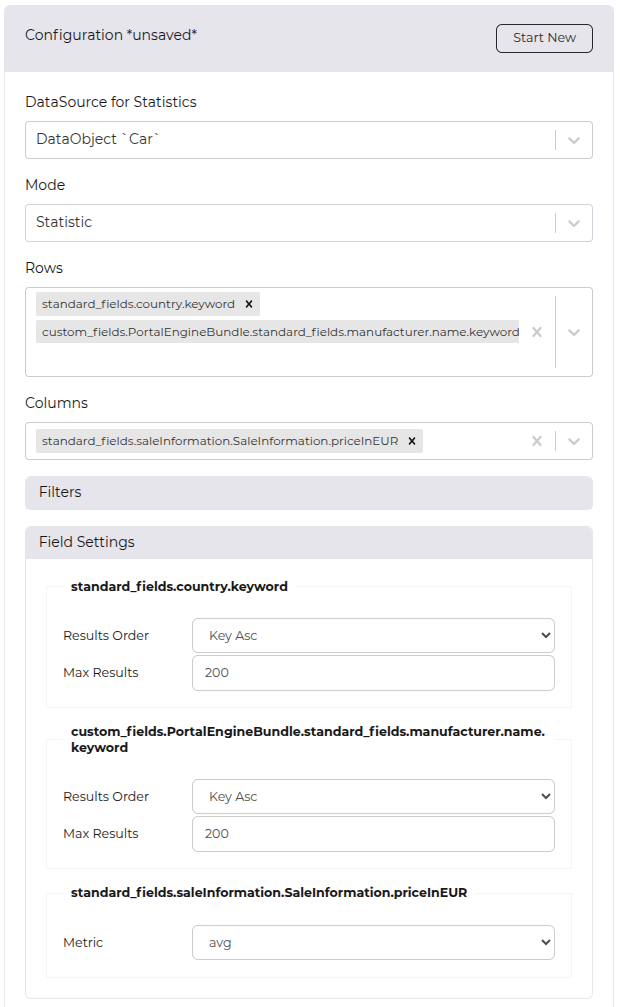
By default, the report counts the number of entries per group. However, if the last attribute in the grouping is numeric (e.g., Price), additional calculations can be applied, such as sum, average, minimum, and maximum values.
Example:
A report grouped by Country and Manufacturer with Price as the last attribute can calculate:
- The average price of products per country and manufacturer.
- The total revenue per country and manufacturer.
- The highest or lowest prices for each combination.
Columns (optional)
Columns define additional attributes that structure the report into a matrix or pivot table. These attributes act as secondary groupings, breaking down data further within each row group. The available attributes are determined by the selected data source.
Adding column attributes allows for more detailed comparisons. For example, when grouping by Category, an additional column attribute like Color enables a breakdown of products by both category and color.
By default, the report counts the number of entries per row-column combination. However, if the last attribute is numeric (e.g., Price), additional calculations such as sum, average, minimum, and maximum values can be applied.
Example:
A report grouped by Category with Color as a column attribute and Price as a numeric value can calculate:
- The average price per category and color.
- The total sales value for each category-color combination.
- The highest or lowest price ranges for each variation.
Field Settings
Each selected attribute has additional field settings. The available options depend on the data source type, field type, and position within the report (aggregation/column/first/last).
Field settings cover aspects such as result order, maximum results, and calculation metrics.
Filters
Filters allow refining the dataset before calculations are performed. They help narrow down the data based on specific conditions, ensuring that reports focus only on relevant information.
Once a data source is selected, available filter options are determined by the data source type and field types. Filters can be applied to limit data based on attributes such as date ranges, categories, numeric thresholds, or text-based conditions.
Example Use Cases:
- Time-based filtering – Show logins within the last 30 days.
- Category filtering – Analyze sales data for a specific product category.
- Numeric filtering – Display only products with a price greater than $50.
